
かるほく朝日町
by 株式会社フェイバーエンジニアリ...
🗂️ Weather

Features かるほく朝日町
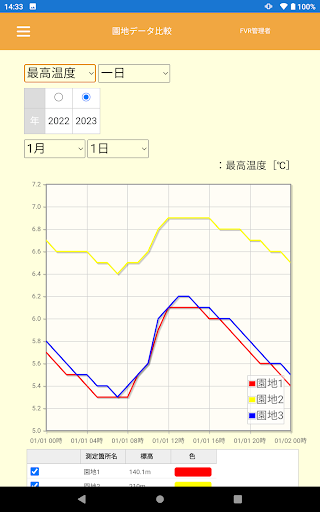
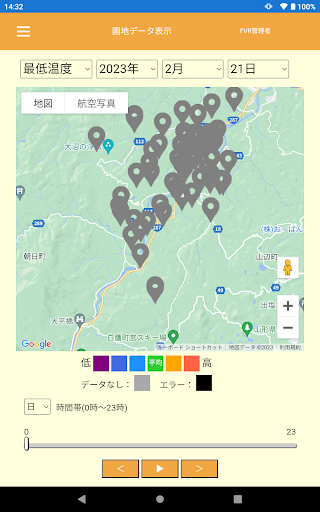
・ You can compare/confirm the park temperature measured by the temperature logger on the map.・ You can check the data by tapping the mark on the map.* About the color display of the mark Compared with the average (minimum, maximum, average, cumulative) temperature, the characteristics of each park temperature are visualized by color. [How to use]• Select the data you want to check (maximum/average/minimum/total).・Determine the year. • Set a date. ・ Decide the display period (day/week/month) at the bottom. ・ You can check the temperature change within the display period by moving the slider. [Display] Daily/Hourly Weekly/Daily Monthly/Daily・ You can compare/confirm the temperature of the park measured by the temperature logger in a graph.Garden temperature comparison: You can compare and display the temperature of each garden.Garden year comparison: You can compare and display the temperature of each garden for each year. [How to use]• Select the data you want to check (maximum/average/minimum/total).・ Decide the period (day/week/month) you want to display on the graph. ・Determine the year. (Choose multiple for yearly comparison)• Decide on the first date to be displayed on the graph. • Select the park/district you want to view.
(multiple possible)*The app name “Karuhoku” is derived from Cultivation of Horticulture Crops and “Akarui Tohoku”.
Gaming Features
Enjoy immersive gaming experience with various game modes.
Weather Features
Get accurate weather forecasts and real-time updates.
See the かるほく朝日町 in Action
Get the App Today
Available for Android 8.0 and above